
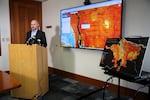
Brendon Haggerty with the Multnomah County Health Department shows a new heat map of Portland on Wednesday. “In areas where we see warmer spots, we can target those for tree planting for example, or removing some of the pavement that we have in place,” Haggerty said.
Kristian Foden-Vencil / OPB
Health authorities in Oregon unveiled a heat map of the greater Portland area Wednesday, in the hope of avoiding deaths during the next excessive heat wave.
On a sunny day last July, Multnomah, Clackamas and Washington counties sent hundreds of volunteers driving around the area with temperature sensors on their vehicles.
They found minimum temperatures of 77 F around Forest Park in the evening and maximum temperatures of 94 F in Tualatin. The official airport temperature that evening registered 89 F.
Brendon Haggerty, with the Multnomah County Health Department, put the data into a map. His goal is for people and governments to use the map to reduce local heat.
“In areas where we see warmer spots, we can target those for tree planting for example, or removing some of the pavement that we have in place,” Haggerty said.
The study follows the heat dome that settled over the Portland area in 2021, killing 69 people in Multnomah County alone. In 2022, five people died in the county as a result of extreme heat in July and in August.
Before 2021, heat deaths in Multnomah County averaged less than one a year.
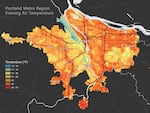
On a sunny day last July, Multnomah, Clackamas and Washington counties sent hundreds of volunteers driving around the area with temperature sensors on their vehicles. They found minimum temperatures of 76 F around Forest Park in the evening and maximum temperatures of 94 F in Tualatin.
Courtesy of Multnomah County
“As climate change continues to affect our local communities in new ways, we must continually review our response and look at data at the neighborhood level to make sure our vulnerable communities are protected,” Haggerty said.
“This study is a powerful tool for protecting public health.”
The study’s results have been turned into a free, accessible map and a report.
Related: Portland area tree planting honors those who died in 2021 heat dome
J’reyesha Brannon, a civil engineer, was one of hundreds of volunteer citizen scientists who drove around the Portland region to collect the temperatures.
“This data could be helpful where the city government policies can provide resources,” Brannon said.
Kathleen Johnson, with the Washington County Health Department, said she’s still learning how best to use the data. “The information will be instrumental in informing our work with communities, community-based organizations, health systems, and governmental agencies to help those living in the hottest areas in our region.”
Clackamas County health officer Dr. Sarah Present said she wants residents to check out the data and prepare before the summer.
“People can better understand their personal risks and make a plan for hot summer days. People can also take small steps with their neighborhoods, employers, and local government to cool these areas down over time,” she said.