
Although there is a wealth of data available, analyzing the performance of the 29 publicly funded salmon and steelhead trout hatcheries in the Pacific Northwest proved a challenging task.
Laila Milevski / ProPublica
This article was produced in partnership with the ProPublica Local Reporting Network.
When I was assigned to a ProPublica collaboration with Oregon Public Broadcasting last year, I was excited to dive into a topic that was totally new to me: fish hatcheries. Over the past two centuries, development has decimated wild salmon and steelhead trout populations in the Pacific Northwest. First overfishing, then hydropower development, destroyed a key component of the local ecosystem, and with it the traditional ways of life for some of the Northwest’s Indigenous people. To address plummeting fish stocks, the U.S. government has poured billions into a network of hatcheries to literally mass-produce fish.
My task was to perform a first-of-its-kind comprehensive analysis of these publicly funded salmon and steelhead trout hatcheries in the Pacific Northwest. As someone who, for years, kept a faithful inventory of my freezer using Google Sheets, I thought this sounded like a reasonable goal. Heck, maybe even a good time. (In hindsight, this may explain why I have so much trouble making friends.)
It was not a good time.
Our investigation ultimately found that the hatchery system built to prop up vulnerable fish populations was failing.
We didn’t find this out with a comprehensive, hatchery-by-hatchery analysis. Our initial idea for how to start the analysis turned out to be impossible. But in the process of discovering that, I learned a little more about how data reporting and science can be tightly intertwined, and about the importance of recognizing the difference between the two. When I missed that distinction, I ended up with a project that spun out of control.
Tag, you’re (not) it
Like many data reporting projects, this one started with publicly available data. My co-reporter, Tony Schick at Oregon Public Broadcasting, part of ProPublica’s Local Reporting Network, sent over a link to a database of tiny metal tags that had been embedded in millions of juvenile salmon and steelhead trout in the Columbia River Basin. The database contains tons of detail about hatchery fish, including the hatchery where they were produced and where they were released into rivers. You can also use the database to get details about the fates of those fish, whether they ended up in a commercial fishing net in the ocean or in a tribe’s ceremonial catch, or, for the lucky few, back at a hatchery spawning ground. (Congratulations on attaining your biological imperative, fish!)
Grouped by production year and hatchery, the data seemed perfect for revealing how well each of the 29 publicly funded facilities was doing in its goal of breeding fish that could make it to the ocean, where they finish maturing, and then survive the trip back upriver to breed again. I thought it would tell us who the winners and losers were in the hatchery Olympics.
My next step was to interview as many fish data experts as I could. I was a little overwhelmed with the details that had initially excited me, and I wanted some guidance on what data fields and criteria I should use to assess each of the 29 facilities. Within months, I went from knowing zero fish biologists to a whole school of them, and I ran my idea of building this comprehensive database past them.
It should have been a red flag that none of my interviewees immediately said, “Oh yes, what a great idea, please do.” Instead, I got a lot of cautionary looks.
Approximately 873 pages into a pile of reports the experts had shared with me, I began to understand why. I realized that in the world of hatcheries, there is no one metric for success. Each hatchery seemed to have a different target for the number of juveniles it released. Each also seemed interested in measuring different characteristics of spawning adults. And some hatcheries counted fish who were caught in the ocean as a success while others were only concerned with fish who survived long enough to return to the river. A few hatcheries I researched were analyzing fish genetics, which helps scientists keep tabs on the trajectory of a certain population through time and geography.

Grouped by production year and hatchery, the data seemed perfect for revealing how well each of the 29 publicly funded facilities was doing in its goal of breeding fish that would survive, swim out to the ocean, and return upriver to breed again. But the lack of standardization for success metrics at each hatchery meant this approach would not be possible.
Laila Milevski / ProPublica
This lack of standardization was frustrating, but it also made sense because individual hatcheries and programs often have different goals. A hatchery charged with rehabilitating an endangered salmon population will want to count something different than a hatchery that’s creating a supply for sport fishing.
That fact helped explain another thing I noticed in the reports: Some of them didn’t seem to be about a single hatchery. Instead, they referred to programs that the hatchery participated in. Brood stock might be collected at one location, their eggs fertilized at a different place, with juveniles moved to yet another facility to mature, and finally transported to a fourth site for release. The hatchery analysis idea had gone bust.
One fish, two fish, trends across entire groups of fish
With some serious holes now poked in my initial idea, I decided to revisit a data portal that various hatcheries staffers had mentioned. Maintained by the Columbia Basin Research center at the University of Washington, the portal reports data about a different type of tag than the ones I was initially looking into. The first group of tags, called coded wire tags, are relatively low-tech and can be embedded in a lot of fish; this sounds like a good thing, except that in order to read those tags, they have to be ripped from the fish’s snout, killing it in the name of science. The data from Columbia Basin Research, by contrast, is based on a type of microchip known as a passive integrated transponder, or PIT, which can be easily detected by a sensor as the fish pass by. If you’ve ever paid a highway toll using an EZPass, you and a fish swimming through a dam in Oregon have more in common than you think.
I’d initially dismissed PIT tag data because I knew that far fewer fish are being tagged with those tags than with coded wires. But the research center’s PIT tag data had two main advantages. For one thing, the fish were grouped by population, defined by species, geography, migration season and history. (Over the decades, dams have had a profound effect on fish populations: Out of nine historic groups of sockeye previously recorded around the Snake River, only one group has survived the building of the dams.) Now that my hatchery-focused approach had imploded, populations seemed like an ideal way to look at how fish were doing.
The research center’s data was also grouped by the location where the tags were scanned, which made it easy to pick a single place and then compare multiple fish populations that passed that spot, even if they’d been grown or released in different parts of the Columbia River Basin. Choosing a point near the mouth of the Columbia River would allow us to see how many of the fish who made it down to the ocean survived to adulthood and began the journey back upstream.
This estimate of ocean survival is by no means comprehensive. But it is a quantity that one of the University of Washington researchers described to me as a snapshot of the “return on investment” of hatchery activities.
This, at last, was the tag data we were looking for.
Angling for answers
As helpful as the Columbia Basin Research portal was, questions remained, like what counts as success.
There was one figure that kept popping up in large-scale reviews of the hatcheries system. In 2003, the Northwest Power and Conservation Council, a federal agency developed to help balance hydropower and conservation priorities in the Pacific Northwest, determined that adult fish would have to return at an average rate of at least 4% to rebuild salmon and steelhead populations. In other words, for every 100 juvenile fish sent to the ocean, four would have to return to fresh water and get a fair shake at spawning. That benchmark has been reviewed and affirmed by independent panels of experts multiple times since its adoption, and it has been cited numerous times by fish biologists in peer-reviewed publications.
But even if we had a benchmark, we still had to decide what time period to look at. When we talked to experts, time and again they mentioned that, like anything in nature, fish survival is extremely volatile. For the same reason that I base decisions about socializing on rolling averages of COVID-19 data, rather than on the statistics reported for a single day, it makes sense to consider fish population survival over multiple years, rather than comparing one year’s survival rates to another’s. So what time span should we look at, and why?
Climate and ocean conditions, which matter a lot for these fish, have tended to follow yearslong trends. On the advice of researchers, we chose two time periods to analyze: The years 2008-2013 represent some of the best Pacific climate conditions seen in recent history, while 2014-2018 were some of the worst, and, conveniently, the most recent complete data available for our fish.
So we went with it. Instead of the database of hatchery-by-hatchery performance we’d initially envisioned, I ended up with just 16 numbers: two for each of the eight salmon or trout populations we focused on, with each number representing how things have been for the fish in a recent good period and in the most recent available period, which was bad.
The once and future fish
It was a bit disappointing to report just 16 numbers after months of work. There is so much more to fish biology that I learned from my chats with all those experts.
But the numbers I reported were important: They showed that between 2014 and 2018, none of the fish populations met the 4% population-restoration benchmark. Even when conditions were good, between 2008 and 2013, only two out of the eight populations managed to have more than 4% of their members make it back to fresh water as adults.
Data analysis showed that between 2014 and 2018, none of the fish populations met the 4% population-restoration benchmark. Drilling down to these numbers is an important way to get the conversation started and to raise hard questions about salmon hatcheries.
Laila Milevsk / ProPublica
Simple as they are, these numbers are an important way to get the conversation started and to raise hard questions about hatcheries. Were these facilities, intended to out-game nature, working? Would they be effective in the changing climate? And if not, how can we keep generating power through dams on the Columbia River and still fulfill U.S. treaties that guaranteed fish to the Indigenous people of the Northwest?
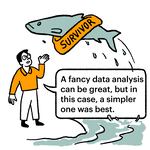
The more work I did to get that handful of numbers, the more I realized that the comprehensive study of hatcheries we’d initially envisioned sounded suspiciously like a Ph.D. thesis on wildlife ecology. Tempting as it might be to start another doctorate, I backed away from that initial goal, and in hindsight it was the right decision.
Because sometimes the best thing a data reporter should do isn’t a super-ambitious, large-scale analysis. More detail doesn’t always mean more insight, or give you the best takeaway from a story. Sometimes data reporting means slogging through thousands of pages of reports and connecting the dots on existing research about a topic so you can present just a handful of telling numbers.
This project reminded me that the second word in my job title, reporter, is just as important as the first.
Irena Hwang is a data reporter at ProPublica.
ProPublica is a nonprofit newsroom that investigates abuses of power. Sign up here to get its next investigation. OPB is a member of the ProPublica Local Reporting Network.