The sun looms over a cloud of smoke from the Santiam Fire near Gates, Ore., Sept. 9, 2020. Fires around Oregon could become the deadliest, costliest in state history.
Bradley W. Parks / OPB
Cleaning up after wildfire smoke
If you live in the Pacific Northwest, you know the smell of smoke. Although increasingly that smell has been coming from wildfires instead of campfires.
Wildfire smoke gets everywhere and can linger on surfaces indoors for months. Not only can the smell stick around, so can carcinogenic chemicals called polycyclic aromatic hydrocarbons (PAHs), which have been associated with increased cancer risk in humans. People are most commonly exposed by breathing or eating, but the chemicals can be absorbed through the skin as well.

This illustration by Danlyn Brennan shows how wildfire smoke residue interacts with household objects.
Courtesy of Portland State University
Researchers at Portland State University found that wildfire smoke residue containing PAHs remained on the surfaces of air filters, cotton cloth and glass for several weeks after smoke exposure. But the good news is that giving things a scrub with common household cleaners can significantly reduce the amount you’re exposed to.
Washing and drying smoky clothes dropped PAH exposure by nearly 50%. Using glass cleaner on cups and windows reduced the chemical exposure by more than 60%. Because air filters can’t be cleaned, the researchers suggest just replacing them after the smoke has cleared.
The paper was published in the journal ACS Environmental Science and Technology Engineering and can be read here.

A photo released by NOAA shows a tsunami evacuation route sign near Newport.
Courtesy of the Crew and Officers of NOAA Ship MILLER FREEMAN
Predicting tsunamis with artificial intelligence
When an earthquake happens, we usually know if a tsunami is coming ahead of time. Part of it is common sense: With the Cascadia fault right offshore, if you feel an earthquake on the Oregon or Washington coast, there’s a good chance a tsunami will follow. We can also get early warning through a monitoring network of seismometers and ocean instruments.
But there are limits to this monitoring technology. The data stations in the ocean are sparse, and a tsunami has to pass by one of them to be detected.
Researchers at the University of Washington are working on a new way of detecting tsunamis that could buy us more time. They’re training artificial intelligence to look for tsunami signals using the Global Navigation Satellite System, an international network of more than a hundred satellites widely used in shipping, air travel and farming.
Based on what the mathematicians are seeing so far, they say AI could eventually become the primary tsunami warning method. Early results show it’s especially well suited to predicting tsunami inundation at inland sites, like communities along the Puget Sound.
The work was presented at the December American Geophysical Union meeting in San Francisco.

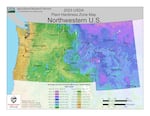
This map generated by Oregon State University and the USDA is a guide to which plants will survive in your yard over the winter.
Courtesy of USDA
Hard data for plant hardiness
Have you ever been out buying plants and noticed on the label a “zone” or “plant hardiness” number? This number corresponds to the USDA Plant Hardiness Zone Map, which shows the 30-year average coldest temperature for different locations across the United States. It’s a guide you can use to know which plants will survive in your yard over the winter.
For the first time in 15 years, that map has been updated by researchers at Oregon State University. The newest version of the map includes climate data from 1991-2020 and data from about 70% more weather stations. It excludes older data to give a much better picture of how climate change is affecting growing conditions. The scientists say they saw an increase of 2.5 degrees Fahrenheit across the contiguous U.S.
But a word of caution before buying perennial plants this spring: Because these maps are based on the average of the single lowest temperature each year, the actual coldest temperatures could be much lower. For example, Eugene’s zone is “8b” with a 30-year average low of 15-20 degrees, but one night in 2013 it got down to -7 degrees. So it might be a good idea to buy a zone or two down to keep your plants happy.
The results were presented at the American Geophysical Union meeting in December.

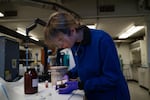
In this photo released by the University of Oregon, postdoctoral student Ana Konovalova shows off the electrochemical cell designed in Paul Kempler’s lab.
Courtesy of University of Oregon
Making steel more climate friendly
Steel is everywhere around us — from the beams that support our large buildings to our kitchen appliances and car frames. But this ubiquitous metal comes with a huge energy cost — 5% of all industrial energy use in the United States goes to making steel. Globally, producing steel accounts for 7-9% of total human greenhouse gas emissions.
Researchers at the University of Oregon have figured out a way to take a bite out of that energy demand by making the production of one of its component parts — iron — more efficient. They’ve developed what they call the “electrochemical chlor-iron process” to purify iron.
The process uses inexpensive and abundant materials (iron oxide and saltwater) and requires far lower temperatures than conventional methods. The materials interact chemically to produce purified iron. The process, which is powered by electricity, could replace coal-fired blast furnaces in iron production, which are the industry’s largest sources of carbon dioxide.
The researchers are currently working to patent the process.
Read more details about the findings in the journal Joule here.

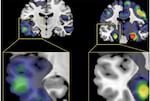
This brain scan released by University of Washington Medicine shows atrophy in the lateral temporal lobe (left) of a participant in AD-Language subgroup and atrophy in the medial temporal lobe (right) of a participant in AD-Memory subgroup.
Courtesy of Alzheimer’s & Dementia
Different types of Alzheimer’s
Worldwide, it’s estimated there are more people with some stage of Alzheimer’s disease than there are people in the United States.
Yet our understanding of the causes and prevention of the disease is still pretty basic. One theory is that there are several distinct subtypes of Alzheimer’s disease that affect memory, language, visual/spatial ability and executive functions such as planning, task follow-through and self-control.
Researchers at the University of Washington have found significant evidence to support this theory. They used MRI scans to examine the brains of nearly 600 people with Alzheimer’s. The patients had been given cognitive tests to categorize their disease type, though not all patients could be categorized. They then looked for patterns of brain degeneration in the scans.
The scientists found that disease subtypes corresponded to specific areas of brain atrophy. For example, people with the visuospatial subtype showed deterioration in the vision-processing part of the brain, with the rest of the brain less affected.
The researchers say if there are indeed biologically different subtypes of Alzheimer’s, then there may eventually be ways to customize treatments for patients depending on their specific symptoms.
Find out more about their work in the journal Alzheimer’s and Dementia here.
In this monthly rundown from OPB, “All Science. No Fiction.” creator Jes Burns features the most interesting, wondrous and hopeful science coming out of the Pacific Northwest.
And remember: Science builds on the science that came before. No one study tells the whole story.
Correction: An earlier version of this story inaccurately compared the number of people with Alzheimer’s to the number of people living in the U.S. There are estimated to be about 416 million people with Alzheimer’s worldwide. OPB regrets the error.
