
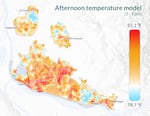
A map of temperatures around Clark County collected at 3-4 p.m. in July 2024. The map, produced by consultant CAPA Strategies, shows where the county was hottest.
CAPA Strategies/Clark County Public Health
How hard it will be to escape the heat in Clark County this summer depends on where you live. That’s according to an analysis from the county’s public health department and the hazard planning organization CAPA Strategies that shows which neighborhoods heat up the most and retain those hot temperatures.
For the project, more than 50 volunteers affixed heat sensors to their cars during one day in July 2024. They drove prescribed routes around the county in the morning, afternoon and evening. The results are not surprising, but they provide an analysis of where the county is hottest down to the street level.
“Areas with more buildings and development tended to be hotter during the afternoon,” said Amy Wilson, an epidemiologist with Clark County. “During the evening, there was nearly a 10-degree difference in temperature depending on where you are in the county.”
The hottest afternoon temperatures occurred in city centers including Vancouver, Washougal and Camas. Cooler evening temperatures occurred in more rural communities like Ridgefield, La Center and Battle Ground.
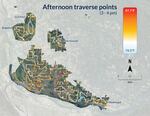
A map of Clark County showing where volunteers drove to collect temperature data in July 2024 as part of the county's heat watch report.
CAPA Strategies/Clark County Public Health
Buildings, roads and paved surfaces tend to hold more heat than natural areas, in what are known as “urban heat islands.” While extreme heat can be deadly, the data shows that its impacts are not felt evenly.
“Communities of color are disproportionately located in neighborhoods with less green space, less shade, fewer parks and other amenities that are protective against the effects of high heat, making them more vulnerable to heat-related illnesses,” according to the county.
High temperatures are associated with heat stroke, cramps and exhaustion, worsening heart and respiratory conditions, as well as mental health impacts, and pregnancy complications, Wilson said.
Clark County’s findings were similar to mapping that took place in Portland following a 2021 heat event that killed dozens of people in Multnomah County.
Record-breaking temperatures in the Pacific Northwest in 2021 also “contributed to an additional 159 injury deaths across Washington state,” according to a study from the University of Washington’s Department of Environmental and Occupational Health Sciences. Those deaths included drownings, transportation accidents, violence and self-harm.
The data collected in Clark County could be used in many ways, including choosing where to put cooling centers and plant trees, according to Amy Koski, the built environment coordinator with Clark County Public Health.
“We’re already communicating regularly with the community as heat events are happening, even this summer,” she said.
This year is already on track to be one of the hottest years on record. May was the second warmest month since NOAA began collecting temperature records in 1850. According to NOAA’s Global Climate Report, it is “virtually certain” that 2025 will rank in the top 10 years for land and ocean temperature, based on historical temperature readings.