This article was produced in partnership with OPB and The Oregonian/OregonLive. OPB is a member of the ProPublica Local Reporting Network.
Timber helped build Oregon, but, since the 1990s, the state’s western counties have lost thousands of jobs and millions of dollars in annual revenue. For decades, much of the blame for the downturn has been placed on the federal government’s decision to reduce logging in national forests.
Related: Big Money Bought Oregon's Forests. Small Timber Communities Are Paying The Price.
An investigation by OPB, The Oregonian/OregonLive and ProPublica examined ownership and tax data to determine the financial losses for counties in the Coast Range from the decline in logging on federal lands and from tax cuts for the timber industry. Our analysis of data found that timber tax cuts have cost counties at least $3 billion in the past three decades. By comparison, counties lost close to an estimated $4 billion due to federal logging reductions. In western Oregon, at least 40% of private forestlands are owned by investment companies that profit from the cuts. We detail the steps of our analysis below.
Part 1: Who owns private forestlands?
Our first task was to determine who owns the most private forestland in Oregon. We obtained spatial data of tax parcels from the assessors' offices of 18 counties in western Oregon, the state's dominant timber region, and removed parcels that are not forestland. Each tax parcel includes the owner's name and address. Many large forestland owners list their properties under different company names, complicating the process. To account for this, we wrote code to clean and standardize the address field. We then mapped the data by owner address instead of owner name.
It is likely that our estimates of how much Oregon’s largest timber companies own are undercounts since our methodology relies on grouping and does not account for all unique owner name/address pairs. The Oregon Department of Forestry, or ODF, used a similar process to develop a timber industry ownership map in 2006. (It has not created one since.) We used the 2006 ownership map to quantify how much the state’s largest timber companies like Weyerhaeuser and Hancock Forest Management grew over time.
Part 2: Tax losses over time

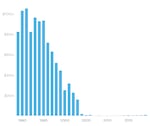
Source: Oregon Department of Revenue
Lylla Younes
For this analysis, we were interested in estimating how much revenue Oregon counties lost from a series of tax cuts starting in the 1990s. The changes included lowering property taxes and phasing out the state’s severance tax, which was based on the value of timber after it was logged. The tax has been eliminated for large timber companies, but forestland owners with fewer than 5,000 acres can still opt to pay it as a means of further reducing their property taxes.
We obtained historical data that shows the amount of timber logged annually and another set of data that shows average log prices from the ODF. To estimate each county's loss in severance tax revenue since 1991, we multiplied the amount logged by the log price for each county and year. The price of timber registered in the ODF data represents the average price of logs at sawmills, which includes the cost of cutting and transporting the logs. Timber owners were taxed on the stumpage price, which is the price without factoring in those additional costs. Stumpage values for private lands are not available, making ODF's log prices the best available source for estimating the timber value from Oregon's private forests. To account for this, we compared ODF log prices to stumpage prices reported for public lands by the U.S. Forest Service. From 1989 to 2014 (the years for which data is available for ODF and U.S. Forest Service), ODF's inflation-adjusted log prices were on average 20% to 25% higher than stumpage values recorded on state-owned forestland in Oregon.
We also compared ODF log prices with harvest values reported by the Oregon Department of Revenue when it still collected a severance tax from all timber owners. This data is available from 1984 to 2001. For that period, ODF's inflation-adjusted log prices were on average 20% to 25% higher than those recorded by the Department of Revenue. As a result of these comparisons, we reduced our calculated revenue estimate by 25%.
Our calculation is likely conservative. ODF economists estimated the transportation and logistical costs in their log prices at $150 per thousand board-feet of timber. Adjusting our timber value estimate resulted in an average reduction of $180 per thousand board-feet.
Until 1991, the severance tax was 6.5% of revenue in a given year for western Oregon counties and 5% in eastern Oregon counties. We took 6.5% and 5% of the calculated timber value estimate for each year, and compared it with the actual severance tax totals in the Department of Revenue data. We vetted our methodology with the ODF and multiple independent economists.
In addition to eliminating the severance tax, Oregon also assesses property taxes at a rate below market value. In biannual tax expenditure reports that begin in 1997, the Oregon Department of Revenue estimates the total amount of money lost to the special assessments. Since then, the department estimates the total loss from forestland property taxes to be about $806 million. We added our calculation of estimated revenue lost from severance taxes to this amount to conclude that timber tax cuts have cost counties at least $3 billion in the past three decades.
Part 3: Comparison to federal payment loss

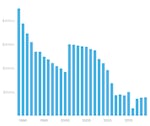
Source: Headwaters Economics
Lylla Younes
One objective of our analysis was to compare revenue losses from the phased out severance tax to those that stemmed from the federal government restricting logging in national forests to protect the northern spotted owl. We obtained county-level federal payment information from Headwater Economics, which uses data from the U.S. Forest Service and the Bureau of Land Management. This data includes payments received by counties for their share of the revenue from timber sales on federal lands, as well as subsidy payments made as federal logging levels declined. To estimate the amount of federal revenue lost in each county since the spotted owl restrictions, we totaled inflation-adjusted federal payments from 1991 to 2019. We then calculated what the revenue would be if counties had received the median payment from 1960 to 1990, and we subtracted the actual total from the estimated total. We selected 1960 because it was the earliest year for which we were able to obtain federal payment information.
We used the median yearly revenue for the 30 years preceding the federal logging restrictions, from 1960 to 1990, to estimate potential revenues had the restrictions not been put in place. Yearly revenues varied significantly over the 30 year period because of many factors, including changes in the number of trees logged and in the price of timber. Because federal payments in 1990, the year federal logging began to decline, were higher than the median, we believe that median yearly revenue for 1960 to 1990 is potentially an underestimate of what yearly revenues would have been from 1991 to 2019 had there been no restrictions on federal logging.