Morning rush hour emptied of cars in Portland, Oregon's I-5 interchange during the coronavirus pandemic, March 20, 2020.
Stephani Gordon/OPB
As the coronavirus pandemic keeps Oregonians home and off the roads, highway traffic and traffic-related air pollution have plummeted in the Portland metro area.
Weekday traffic on Portland's freeways is down 46% from last year, according to a report from the Oregon Department of Transportation.

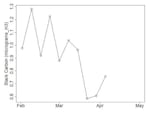
A graph of black carbon levels detected at the Oregon Department of Environmental Quality air monitoring station along Interstate-5 from February to April.
Courtesy of Oregon Department of Environmental Quality
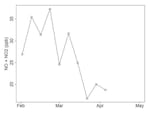
Meanwhile, the Oregon Department of Environmental Quality has found about a 40% reduction in traffic-related air pollution at its air quality monitoring station along Interstate-5 in Tualatin.
Nitrogen dioxide and black carbon are two pollutants in car exhaust, and they both dropped precipitously from March to April along I-5.
While the timing matches up with Gov. Kate Brown’s orders for Oregonians to stay home to prevent the spread of the coronavirus, Laura Gleim with DEQ said wind and weather are also affecting how much pollution the state's air monitors are picking up.

A graph of nitrogen oxide and nitrogen dioxide levels from February through April at the Oregon Department of Environmental Quality air quality station along Interstate-5 in Portland.
Courtesy of Oregon Department of Environmental Quality
“When you look at the graphs it looks fairly significant, but there’s a lot of factors that affect those numbers,” she said. “It’s important to note that some of the fluctuation we’re seeing is because of changes in weather, wind speed, direction, temperature. Pollutants rise and fall based on weather.”
Vivek Shandas, professor of urban studies with Portland State University, has been analyzing the same satellite data that shows huge pollution reductions in cities around the world during the coronavirus pandemic.
So far, though, he's seeing a reduction of less than 2% in nitrogen dioxide across Oregon and Washington. He said the lower numbers could be the result of clouds interfering with satellite data, and they also reflect the fact that other cities started out with a lot more nitrogen dioxide pollution, or NO2, than cities across the Northwest.
"In places where there's a lot of NO2, it’s a good signal," he said. "So, Beijing or Delhi or parts of northern Italy where there's a lot of it being produced— L.A. was a good example in the US. There were clear days. There was a lot being produced from cars, and it turns out that affects the ability of the sensor on the satellite to pick up the difference between pre- and post-COVID emissions."
Shandas said satellite data show urban areas are seeing more air pollution reductions than rural areas in Oregon and Washington, and he's working with city and state officials to quantify those differences and the resulting health benefits of air pollution reductions.
He also pointed to a new article published in the scientific journal Nature that underscores how weather and the angle of the sun in the northern hemisphere can be complicating factors in determining whether nitrogen dioxide levels are dropping because of coronavirus-related restrictions or seasonal changes that naturally lead to a 50% drop in that pollutant from January to May.
