
When Oregon Public Broadcasting began its coverage of the Cascadia subduction zone and Oregon's seismic vulnerabilities, the "tank farms" in Northwest Portland emerged very quickly as an important part of the series.
Fuel reserves and oil and gas supply lines are concentrated within a six-mile stretch next to the Willamette River. That creates a known risk for earthquake recovery efforts and poses the threat of a major oil spill.
These risks have been known since at least 2013. That's when the state released a report on the subject. The goal of our story was to present new information and a deeper understanding of this issue, including what had been done about it since the report came out. The issue had received very little publicity since initial news coverage.
The report underscored that much of this infrastructure was built before seismic requirements in building codes. We wanted to know more about the ramifications.
So where to start searching for information? These facilities are regulated by a number of agencies. The Oregon Department of Environmental Quality (DEQ) regulates the actual equipment of these tank farms. So we sent a public records request to DEQ asking for documents about these facilities.
The documents included each facility's oil spill contingency and response plan. Facilities transferring oil over water, like most of the petroleum terminals along the Willamette, are required to file these with DEQ.
And within those response plans are facility diagrams and lists of storage tanks. The diagrams show all structures and equipment within the property, including the location of storage tanks.
Each company's tank lists are a little bit different, but all of them at a minimum included an identification number, the tank's contents, its capacity and when it was built.
One tank farm included in the state's report, operated by Shell, is not included in our map. This is because Shell's port is no longer active, causing DEQ to deregulate it in 2011. Thus, the state was unable to provide facility information for Shell's tank farm.
Some of these reports were available in electronic PDF formats; some were only available in hard copy. Neither of which is ideal for making an interactive map.
Once these diagrams and tank lists were in hand, each facility operator was contacted and provided with the materials. Each had an opportunity to inspect the diagrams for inaccuracies or outdated information. In some cases, facilities responded with more up-to-date diagrams or notes about changes to tanks. That new information was then incorporated into the files we created before using a tool called Tabula to create spreadsheets that we used for data analysis.
The facility diagrams needed to be mapped according to their actual location. To do this, each hard copy diagram was scanned and turned into a digital image using the TIFF format. Those TIFF files were then georeferenced using a Geographic Information Systems software called QGIS.
We used latitude and longitude reference points of nearby street intersections or prominent tanks whose locations could be identified on Google Maps. These coordinates told the GIS program where certain parts of the image should be projected into a digital map and it did the rest.
That's a fairly inexact process, though. The map showed up close to where it should have been, but not exactly. Some parts of the image were also stretched out of proportion.
However, doing this allowed these diagrams to be matched with a different database: Portland's building footprint, which is maintained by the City of Portland and has much more accurate locations and building shapes.
Lining those two datasets up produced this:
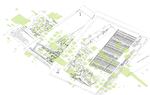
Based on matching locations, unique tank identification numbers were added to the field in the building footprint database. Some tanks had been added or removed at these facilities that were not reflected in the City of Portland database. In those cases, some additional changes were made by hand.
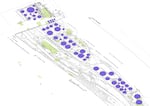
The City of Portland data did not contain information like the owner, construction year, contents or capacity. Using GIS software, the spreadsheet of tank details was merged with the building footprints based on the tank's identification number.
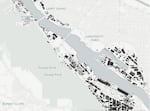
That produced a mappable database of storage tanks and their contents, shown here in purple:
Tanks were then mapped and shaded according to their year of construction. Categories for year of construction were created based on key dates for seismic requirements in Oregon’s building codes outlined in DOGAMI’s report.
DOGAMI experts were again asked to review these categories specifically for this project.
The end result created a map that looks like this:
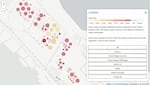
The final map for each facility was then cross-checked against its original tank lists and diagrams.
Creating a step-by-step graphic
The project was nearly complete. But we wanted to create a step-by-step graphic to convey how these tanks were built upon soils with a liquefaction risk, and how that came to be known.
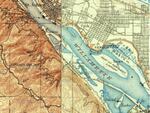
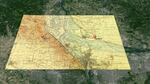
We created digital map tiles out of historic topographic maps from 1905, which the U.S. Geological Survey makes available online.
Those map tiles could then be superimposed over present-day maps, which showed exactly where lakes and the river path used to be.
Portland's building footprint data was then used again to illustrate how infrastructure had built up over the years.
The paths of petroleum and natural gas pipelines are noticeably missing from this. Such data is difficult to obtain. However, the fact that several do indeed pass through the area, including, is evidenced by this USGS study.
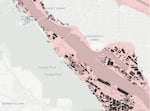
The third step introduced the risk of liquefaction. The outline of areas with potential soil liquefaction was taken from Oregon Department of Geology and Mineral Industries (DOGAMI) modelling showing ground deformation from soil liquefaction.
Once the online versions of the maps were created, the entire projected was then vetted for accuracy by experts at the Oregon DEQ, DOGAMI and the Oregon Department of Energy.
Here's the final product: