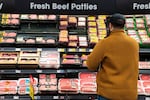
In this handout image, Bryan Vance compares the prices of 80/20 ground beef at a Newberg grocery store on April 10, 2026.
Branden Andersen / Newsberg / Courtesy of Bryan Vance
On a recent October day, Bryan Vance walked the isles of a grocery store in Southeast Portland. His shopping cart had a handful of staple items: bagels, potatoes and pasta. As he passed the cheese department, the medium cheddar caught his eye.
“Winco really only carries Tillamook and Winco Foods cheddar,” he explained, “But when you get into a store like Trader Joe’s, which actually has a pretty big cheese section, it becomes a bit complicated to figure out which one is the cheapest.”
For over a year, Vance has been methodically tracking the cost of everyday grocery items, taking note of everything from sandwich bread to ground beef and cooking oil.
The price of food is more than 30% higher than it was before the pandemic. And other basic living expenses for things like fuel, electric utilities and housing are all up year-over-year, according to U.S. Bureau of Labor Statistics data. These rising costs are what inspired Vance to start tracking common grocery store items in the Portland metro area in a free newsletter.
Vance said the idea for Stumptown Savings came to him in spring 2025.
“We were dealing with record-breaking egg prices, food felt like it was getting really expensive [and] I had just gotten laid off,” he said. “[The newsletter] was a response to rising costs and decreasing wages.”
The Google sheet where he tracks items is now 5,500 lines long. Every month he adds 400 unique points of data.
Vance tracks 20 different food items that he thinks represents the standard American grocery basket, focusing on what people regularly buy and what’s available at most stores. That includes common items like apples, yellow onions, romaine lettuce, ground beef, a dozen large eggs and a gallon of whole milk.
He also tracks shelf-stable items like canned tuna, spaghetti, ground coffee and toilet paper, “Because everybody has to buy toilet paper,” he said.

Bryan Vance shares the spreadsheet he has tracked grocery prices on since April 2025. Each month, he tracks the prices of 20 different grocery items more than a dozen local stores.
Crystal Ligori / OPB
He aggregates prices from national chains like Fred Meyer and Safeway in addition to smaller, boutique grocery stores like Zupan’s and the Alberta Co-op. Since not all prices are online, Vance goes in-person to at least half of the stores he tracks every month.
“It is pretty labor intensive,” he said. “I’m not relying on A-I scraping stuff. I’m not relying on store submitted data. I’m really coming to the stores, putting my boots on the ground and walking through them.”
His model could be replicated in other cities or states, but Vance said it’s incredibly time consuming.
“I’ll have people be like, ‘I wish you were in Miami or Philadelphia,’ and theoretically there’s nothing stopping someone from taking what I’m doing and doing their own version of it elsewhere,” he said. “It’s just if they have the time and the means.”
After being laid off last year, Vance does have the time to dedicate to this, but because Stumptown Savings is primarily reader-supported, it’s not a money-making endeavor.
“Realistically, I probably shouldn’t be doing this full time,” he laughed. “But things just keep getting more expensive, people [are] dealing with cuts to food aid. I feel like people really need this, so I don’t want to quit because I feel like I’d be leaving people hanging.”
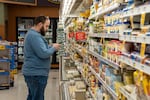
In this handout image, Bryan Vance compares prices at a Newberg grocery store on April 10, 2026.
Branden Andersen / Newsberg / Courtesy of Bryan Vance
Increasing food prices have been a strain for many low-income individuals and families. Recent data from the Oregon Department of Human Services shows that nearly 640,000 thousand Oregonians relied on the Supplemental Nutrition Assistance Program, or SNAP, in August. And each month more people are losing out on this federal assistance, after the Trump administration changed how people qualify for the program.
“The one consistent thing I’m hearing from everyone is that it’s just getting more expensive for all of them,” he said. “Even people who aren’t necessarily struggling, they’re still noticing that everything has gotten more expensive at their stores.”
As Vance pushed his cart across the parking lot, another shopper stopped him to talk about grocery prices.
“I do a lot of math and really pay attention when I’m shopping,” said KJ Fulford. “I now get food stamps, so I kind of have more leeway on what I get. But I still obviously try and stay away from the more expensive stuff.”
Fulford also has another reason to be more conscious of his grocery budget.
“I also just had a kid, so I also have to save some of that for baby formula as well,” he said.
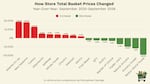
This shared graphic from Stumptown Savings shows how the prices of grocery items have changed year over year from September 2025 to September 2026.
Bryan M. Vance/Stumptown Savings